This article was first published in the National Post on March 27, 2021. It is being republished with permission.
by Tom Bradley
Did I read that right? Was my portfolio really up 25% over the last year? How can that be?
Get ready for statement shock. That’s what many investors will experience when they open their next statement. The year ending March 31 will reflect an unadulterated, uninterrupted bull market. The meltdown in March 2020 will no longer be part of one-year returns and what a difference that will make. For you, 25% may be on the low side.
End-date sensitive
It’s a strange thing about investing. At one point, returns look good and you’re on track with your plan. A quarter later, the numbers are underwhelming and you’re wondering what happened. The flip from “I’m doing fine” to “what happened?” goes both ways and can occur in a heartbeat.
This phenomenon is known as “end-date sensitivity.” Returns can swing wildly when time frames change. One or two good (or bad) quarters can jerk the short-term returns around and put a shine (or pall) on the three- and five-year numbers.
Why does this happen? Well, think about what makes up a one-year return. The twelve months ending Dec. 31 had eleven good months and one disastrous one. Moving the end date forward, the meltdown month disappears and is replaced by a positive one.
Last September our Founders Fund had a one-year return of 0.4%. Three months later at year-end, the number was up to 8.5%. Advance another three months to the quarter ending next week and the fund’s one-year return will be in the mid twenties (subject to the last few days of the quarter). Founders is a balanced fund. All-equity portfolios should be up much more, and ones heavily invested in U.S. tech stocks will look like a lottery win.
The jump from December to March is a good reminder to make sure to always use the same time frame when making comparisons and assessing returns. You don’t want to fall victim to end-date sensitivity.
Like fine wine
Your next statement is going to be fun to look at, but while rejoicing remember that the only useful measure of how you’re doing is your long-term return (at least five years and preferably ten or more). That is, time periods that are long enough to include ups, downs, and all things in between. A variety of markets that truly test the mettle of your plan and your manager.
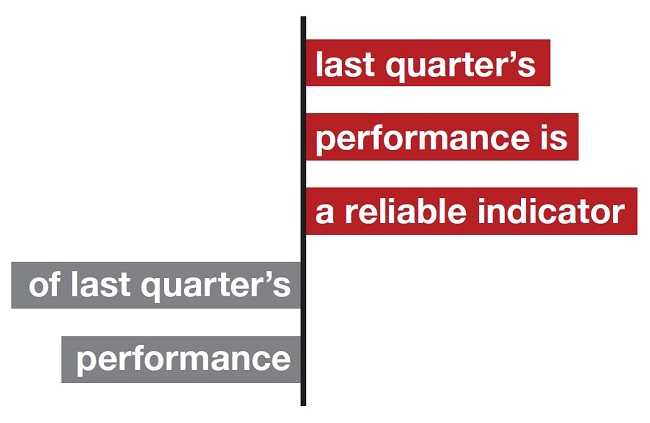
Think of your returns as a fine wine — the value of the data gets better with time. There’s virtually nothing to be learned from a three-month number. Indeed, we have an expression around our shop: “Last quarter’s performance is a reliable indicator of ... last quarter’s performance.”
As you move across the return table, however, the information becomes more useful. For a balanced portfolio, ten years should be long enough for a good assessment of your performance, recognizing that it won’t necessarily represent a full cycle for all the underlying components. Some asset classes like bonds and U.S. stocks may ride the same trend for more than a decade.
America the good, bad, good
Consider what U.S. stocks have done over the last 30 years. This market, with its heavy technology influence, has had three decades that were distinct and one dimensional. In the 1990s, U.S. stocks had a remarkable run. The average annual return for the S&P 500 was 18% (in U.S. dollars). Yes, 18% per year. America was the place to be.
But this lengthy period was not indicative of a sustainable return. Starting in 2001, U.S. stocks entered the Lost Decade in which the average annual return was -1%. By 2010, investors were scrambling to minimize their exposure to the U.S.
You know where I’m going with this. The follow-up to the Lost Decade was nothing short of spectacular. For the ten years ending last December, the S&P 500’s annualized return was 17%.
Investment returns come in weird and wonderful ways. When short-term results are glorious, like they will be on your upcoming statement, make sure you enjoy them. Just don’t change your investment plan, or lifestyle. Use the strength to do some rebalancing (if required) or set money aside for a kitchen renovation or new vehicle. But don’t read too much into one quarter’s statement. After all, you may feel differently three months from now.
Management fees and expenses all may be associated with mutual fund investments. Please read the prospectus before investing. Mutual funds are not guaranteed, their values change frequently and past performance may not be repeated. The indicated rates of return are the historical annual total returns including changes in unit value and reinvestment of all distributions and do not take into account sales, redemption, distribution or optional charges or income taxes payable by any securityholder that would have reduced returns.
We're not a bank.
Which means we don't have to communicate like one (phew!). Sign up for our blog to get the straight goods on investing.

