By Neil Jensen
We've added a number of new features to our statements over the past months, notably the Account (or Portfolio) Activity table and Account (or Portfolio) History chart. While they are generally straightforward, I want to spend a bit of time reviewing some of the subtleties. [note: these features appear in our Q3 2013 statements]
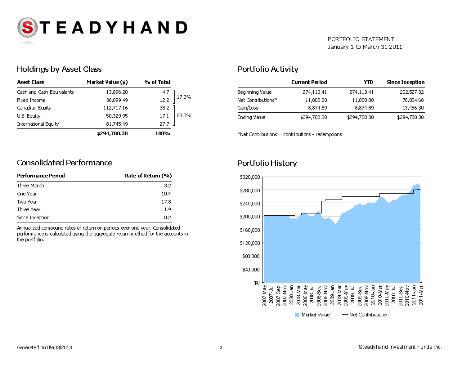
Before I begin, here is an overview of how the new page looks:
Account (or Portfolio) Activity Table
The activity table is designed to give you a birds-eye view of how your account or portfolio has performed. I'll use the following table as an example, and refer to the numbers in red as I explain each section.
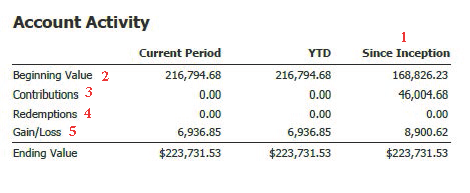
- Time Frames – the three columns show all activity since the opening of the account ('Since Inception'), the current year up until the statement end date ('YTD'), and the reporting period for the statement ('Current Period'). The reporting period of the statement is displayed in the upper right hand corner of the page.
- The Beginning Value is the market value at the beginning of the reporting period or the year. To be precise, it is the market value on the last day of the previous period. The Since Inception beginning value is a little different – if we used the previous day (before the account was opened), it would always be zero, so instead, the beginning value is the market value at the end of the first day the account is opened. This is always equal to the first day's purchase or transfer-in amount.
- Contributions consist of purchases and transfers-in to the account. The first day's purchases are NOT included in this amount, as they are included in the Beginning Value of the account on the inception day. Also excluded are switches, re-invested distributions, and management fee rebates, as they do not constitute cash movement in to the account.
- Redemptions are redemption trades, transfer-outs, and cash distributions.
- The Gain/loss is simply calculated as: Ending Value – (Contributions – Redemptions) – Beginning Value
All figures are Gross, i.e. they exclude the impact of withholding taxes.
The Portfolio Activity table is slightly different in that it only shows the Net Contributions in the portfolio, rather than breaking out the contributions and redemptions separately. This is because we often have clients who redeem funds from one account and purchase into a different account within the portfolio, and it is confusing to see these transactions listed as separate contribution/redemption amounts (money is not actually leaving or entering the portfolio).
Account (or Portfolio) History Chart
This chart is the visual equivalent of the Activity table, with a month-by-month view of the account's (or portfolio's) market value and net contributions.
Here is an example of a chart for a portfolio:
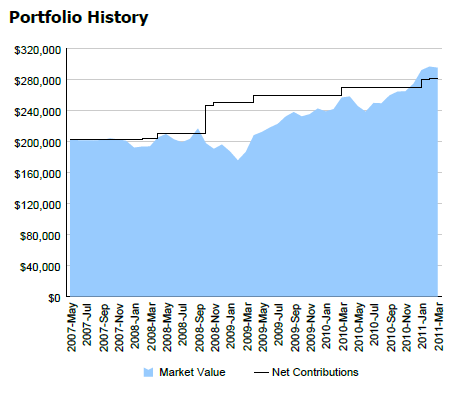
A few points to note:
- All values are at month-end; if there are multiple contributions/redemptions within a month, it will appear as a single change to the Net Contribution line.
- The chart will always show from the inception of the account (or portfolio) to the statement end date.
- Net Contributions are shown as a 'step-to-point' line (i.e. a step increase or decrease), while the market value series is 'point-to-point' (i.e. the line may be sloped between month-ends).
- We only display the chart when there is three or more months of data.
- When the market value is larger than the net contribution line, the account/portfolio has made money. When the market-value is less than the net contribution line, the account/portfolio has lost money.
There are instances when these charts can appear counter-intuitive. For example, when an account is closed after experiencing a gain. In this case, the net contribution amount swings to a negative number, as the redemption amount (market value on the account closing date) is larger than the net contribution amount.
In the example below, the account was opened with an initial purchase of $66,657, which is also equal to the initial net contribution amount. When the account was closed, the ending market value was $70,865, which was redeemed in its entirety, leaving the net contribution amount equal to $66,657-$70,865 = -$4,208. The $4,208 is equal to the gain in the account.
The negative net contribution persists on the chart until the statement end date.
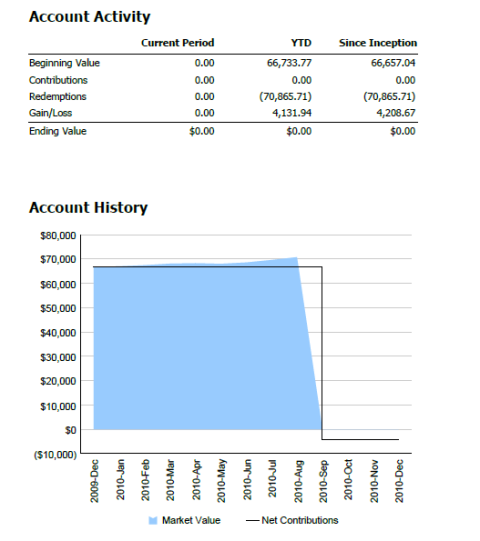
Conversely, if an account is closed in a loss position, the net contribution amount will be positive.
We're not a bank.
Which means we don't have to communicate like one (phew!). Sign up for our blog to get the straight goods on investing.

Steadyhand helps Canadians grow their wealth with a simpler, more human experience. Learn more.